Shop-floor efficiency
Software to measure and improve OEE
Bold calculates OEE automatically from what your operators already record on the shop floor. No spreadsheets and no reports to type up: you know where you lose efficiency and where to start.
Why OEE in a spreadsheet does not work
It arrives late
By the time you have collected the reports and updated the sheet, the shift is over and nothing can be corrected.
It relies on handwritten data
Times and stoppages noted from memory at the end of the shift give an OEE nobody quite believes.
It does not say where to act
A single overall figure does not explain whether the problem lies in stoppages, pace or quality.
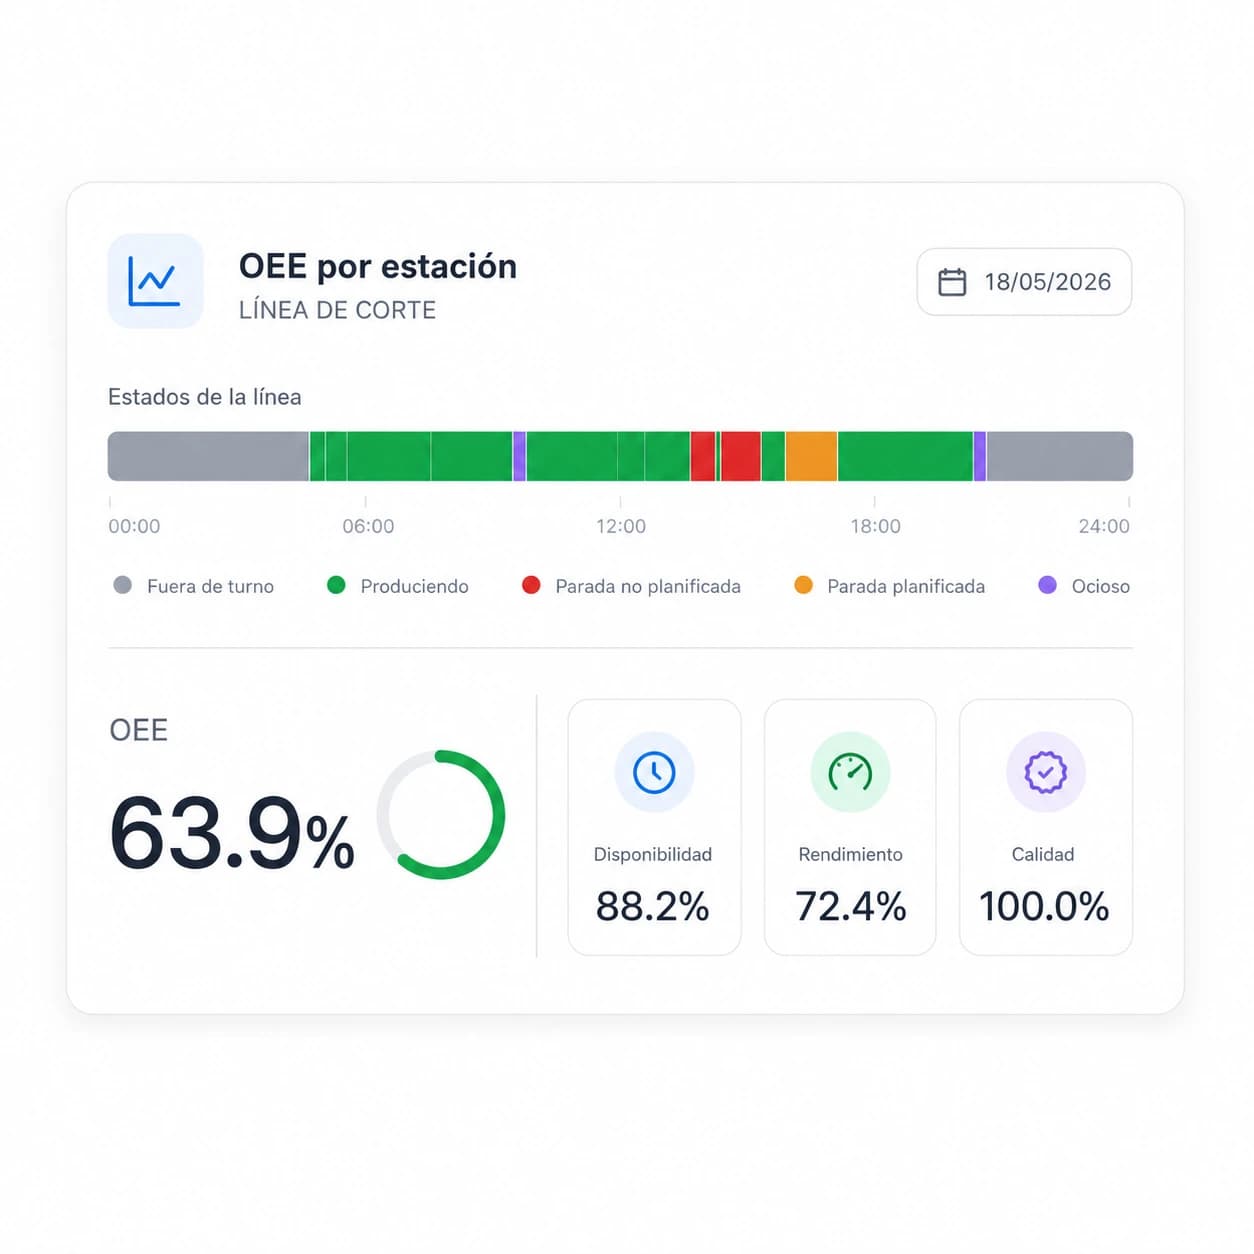
Automatic, real-time OEE
Bold calculates OEE from the data your operators capture as they work: production times, stoppages, pace and defective units.
There is nothing extra to fill in and no waiting for the end of the shift: the indicator updates as production progresses.
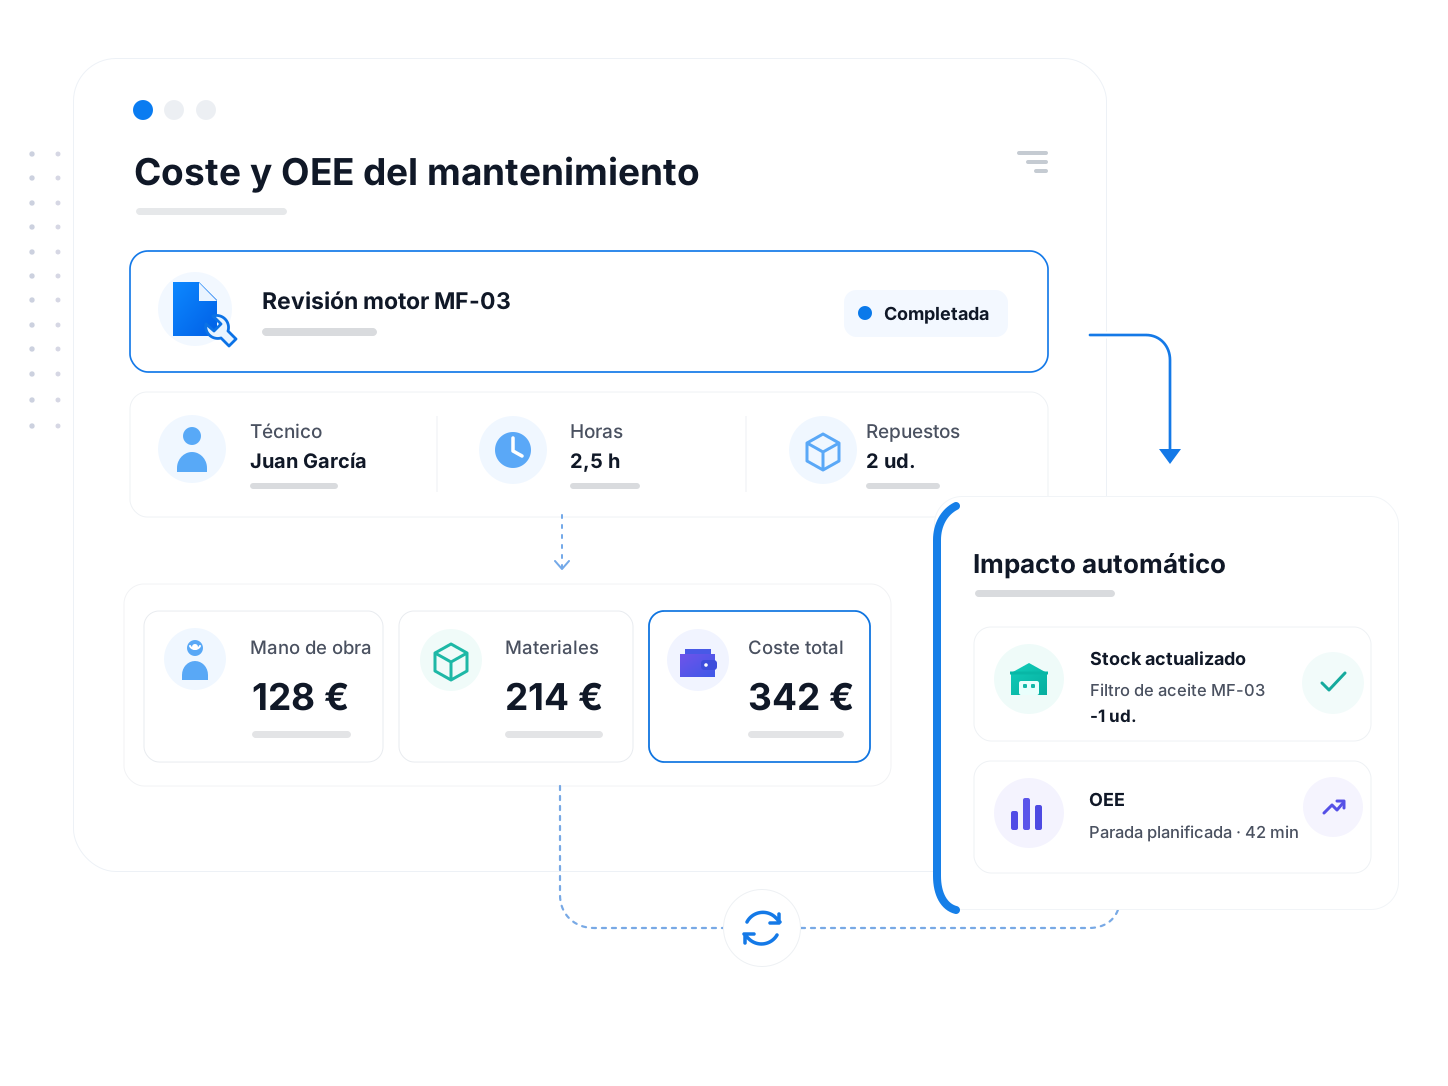
Maintenance downtime counts too
Every maintenance intervention enters OEE as planned or unplanned downtime, because production and maintenance share the same platform.
You see how much availability is lost to breakdowns and how much to preventive work, and decide with numbers where it is worth acting.
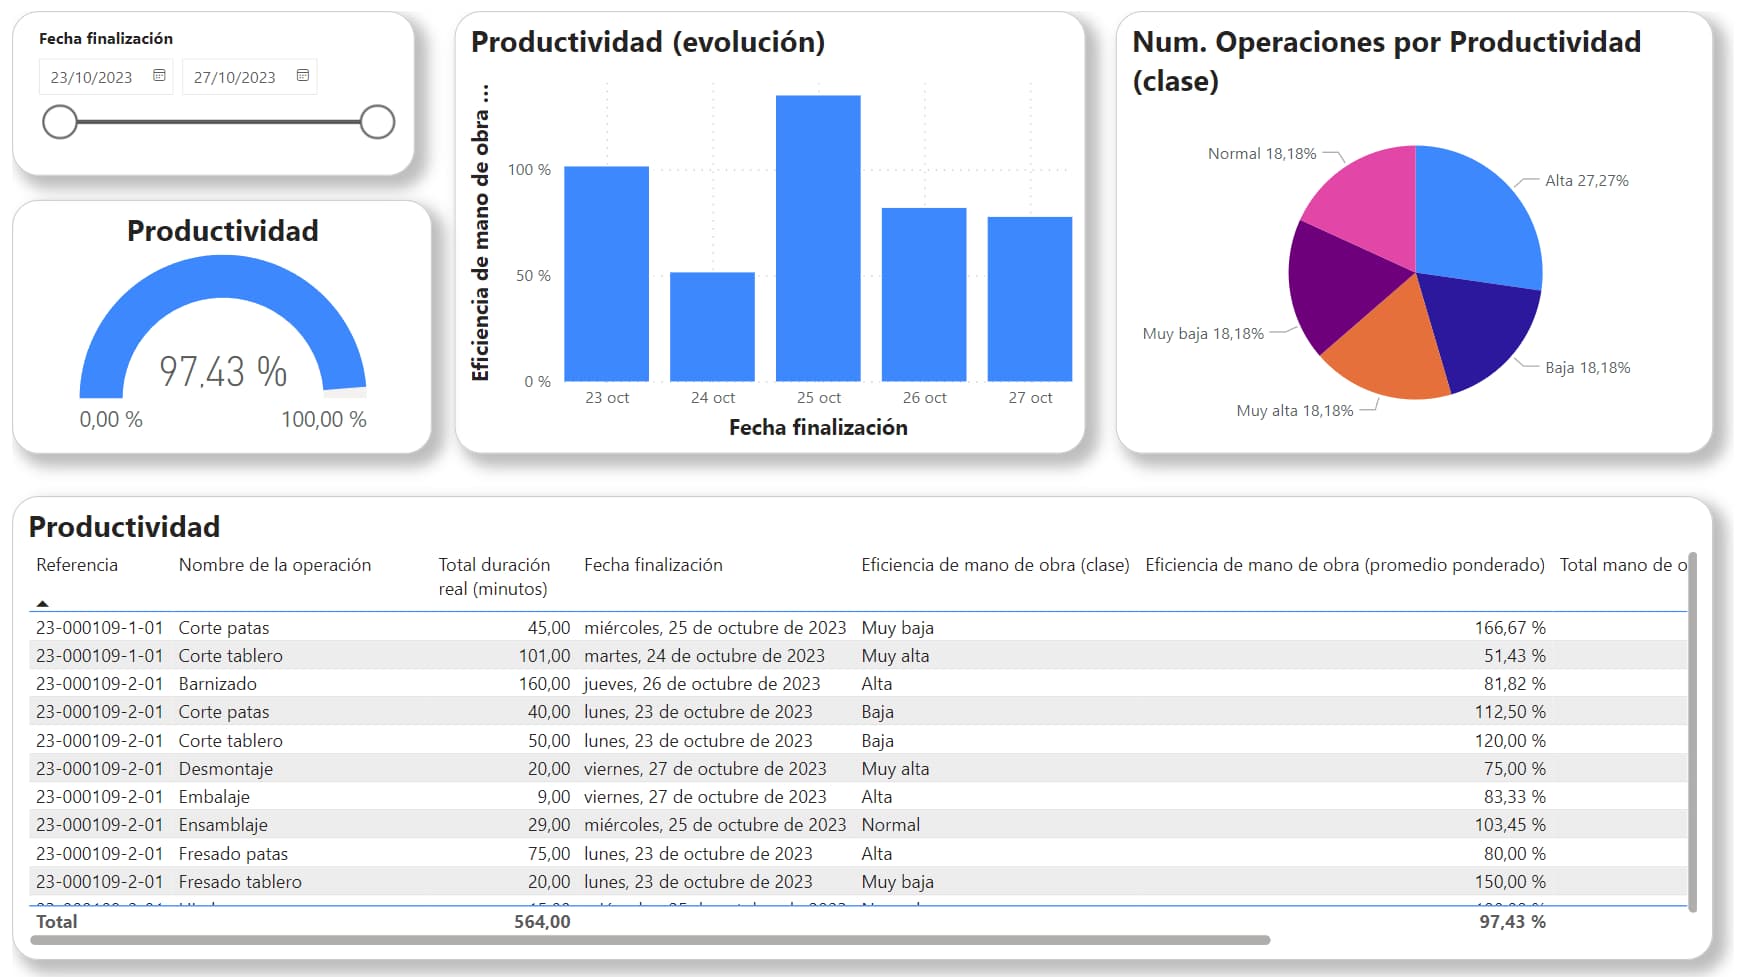
Broken down by machine, shift or product
View OEE and its three components (availability, performance and quality) by machine, shift or product.
With dashboards you can filter and drill down until you find the cause, and track how it evolves over time.
The modules that make it possible
Each solution relies on modules that share the same data. Start with the one that has the most impact and expand when you need to.
Frequently asked questions
Find out where your shop floor loses efficiency
Tell us how you measure efficiency today. We'll show you how Bold calculates OEE from your own shop-floor data and how to locate the losses. OEE from reliable data.
- Real-time OEE
- Stoppages under control
- Breakdown by machine and shift
A demo focused on your shop floor