Maintenance Managers: Reduce MTTR in Months and Improve MTBF

2026-05-12

MTTR (mean time to repair) measures how long it takes your team to return a machine to service after a failure. MTBF (mean time between failures) measures how many hours that machine operates, on average, before failing again. Together, they determine the actual availability of your assets: availability = MTBF / (MTBF + MTTR). The higher the MTBF and the lower the MTTR, the more productive hours you gain without buying a single new machine.
In brief:
To improve availability, it is essential to reduce MTTR by ensuring efficient spare-parts management, clear procedures, and ongoing technical training.
MTBF is calculated by excluding scheduled downtime and considering only internal failures. It is also advisable to break down the measurement by asset or machine class to identify specific problems.
The most commonly used approach to measuring MTTR is to record the repair phases, since identifying bottlenecks at each stage makes it possible to take specific, rapid action.
A ratio above 200 between MTBF and MTTR indicates a healthy asset system, while low values point to frequent failures or slow repairs.
Implementing automated CMMS or MES systems helps produce accurate measurements and optimize repair times and equipment reliability in real time.
Table of contents
-
How a CMMS/MES makes it easier to measure and improve MTTR and MTBF
-
Priorities and roadmap: when to tackle MTTR and when to tackle MTBF
-
Bold Factory: Measure MTTR and MTBF without scattered Excel spreadsheets
What is MTBF? Definition, formula, and limitations
MTBF applies to repairable assets: pumps, motors, packaging lines, and any equipment that is repaired and returned to operation rather than replaced. The formula is simple:
MTBF = total operating time ÷ number of failures
If a press operates for a significant number of hours per year and fails several times, its MTBF is calculated by dividing the total operating hours by the number of failures. Here’s the detail almost nobody explains properly: scheduled preventive maintenance downtime does not count as a failure and must be excluded from the calculation. Otherwise, you get an artificially low MTBF that does not reflect the equipment’s actual reliability.
There are limitations to MTBF that are worth knowing before using it to make decisions:
-
It is a statistical average, not an exact prediction: an MTBF of 900 hours does not mean the machine will fail precisely every 900 hours.
-
It depends on how you define a “failure”: a shutdown due to an external power supply issue is not the same as an internal mechanical breakdown, and combining the two distorts the metric.
-
An MTBF calculated across an entire fleet of machines conceals the problem assets that drag down the average.
Professional tip: Calculate MTBF by asset class (all centrifugal pumps) and also for each individual unit. If a particular pump has an MTBF far below that of its class, it is an obvious candidate for root cause analysis before it drags down the overall indicator.
What is MTTR? Variants, phases, and a practical formula
The “R” in MTTR does not always mean the same thing, and confusing the variants leads to comparing figures that are not comparable:
-
Repair (repair): time from when the technical intervention begins until the machine is operational again.
-
Recovery (recover): also includes restoring associated processes or data, which is typical in environments with control systems.
-
Resolution (resolve): covers the time until the problem is closed and documented, not just repaired.
-
Response (respond): measures only the time until a technician attends to the alert, not the repair itself.
For industrial maintenance, the most commonly used variant is repair, and its operational formula is:
MTTR = total repair time ÷ number of incidents
But the overall figure hides the real problem. Breaking it down by phase makes it actionable: failure detection, cause diagnosis, waiting for spare parts, physical repair, and verification before returning to production. Each phase has a different lever: detection improves with sensors and alarms, diagnosis with breakdown histories, waiting for spare parts with inventory management, and verification with standardized checklists.
Professional tip: Record a timestamp for each phase, not just the start and end of the intervention. An [object Object] reveals whether your real problem is the reporting bureaucracy, missing spare parts in the warehouse, or a lack of technical training—and each requires a different approach.
Without phase-by-phase records, any MTTR analysis is a black box: you know something is taking too long, but you don’t know which part of the process is causing it.
Calculating MTTR and MTBF: a step-by-step example
Consider a packaging line that runs 20 hours a day, 6 days a week, for one month:
-
Planned operating hours for the month: 480 hours.
-
Number of recorded failures: 4.
-
Total hours spent on repairs (the sum of the 4 interventions): 12 hours.
With these figures, calculating MTBF is straightforward: divide effective operating time by the number of failures. If you subtract the 12 hours of downtime from the 480 planned hours, you get 468 hours of actual operating time across 4 failures—that is, MTBF = 117 hours.
MTTR is calculated by dividing the repair hours by the number of incidents: 12 hours ÷ 4 failures = MTTR = 3 hours.
That figure means that, out of every 100 hours the line should be producing, it actually does so for 97.5 hours. The rest are hours lost to breakdowns, not planned downtime or a lack of orders.
To adapt this calculation to your plant, replace the operating hours and number of failures with the actual data for an asset or asset class over a representative period, ideally a full quarter to smooth out isolated spikes in breakdowns.
MTBF vs. MTTF and other metrics: MTTA, OEE
MTBF and MTTF (mean time to failure) sound almost identical, but they apply to different things. MTBF applies only to repairable assets: the pump is repaired and keeps running, so it can fail several times and accumulate multiple intervals between failures. MTTF is used for non-repairable components that are replaced when they fail, such as a sealed bearing or an industrial light bulb: there is no “between failures” because the component only fails once, at the end of its useful life.
Other metrics complete the picture:
-
MTTA (mean time to acknowledgment): measures how long it takes a technician to confirm they have received the breakdown alert, even before they start diagnosing it. It isolates the detection phase of MTTR as a separate indicator.
-
OEE (overall equipment effectiveness): combines availability, performance, and quality. The availability you calculate using MTBF and MTTR directly feeds into one of the three OEE factors.
The practical recommendation is not to pursue all five metrics at once. Start with MTTR and MTBF, which are the basis of availability, and add MTTA when you want to fine-tune your on-call teams’ response times specifically.
Indicative benchmarks and factors that influence values
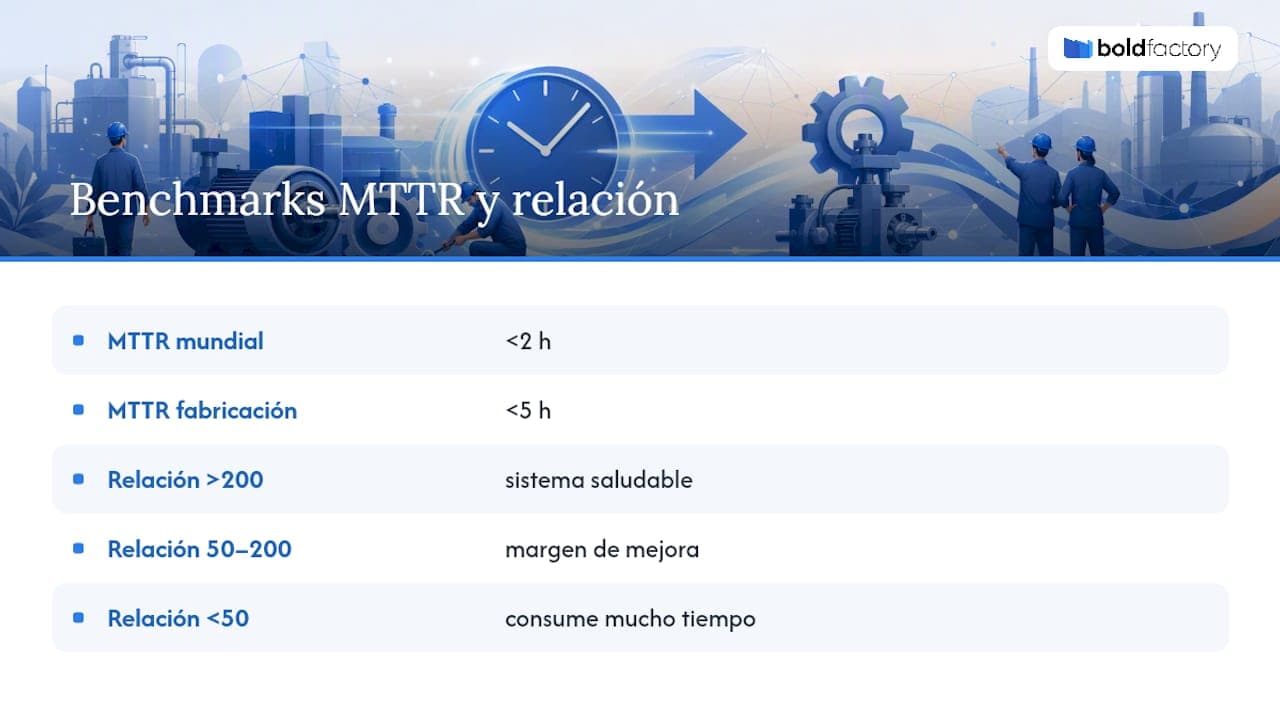
Reference ranges vary so much by asset type that citing them without context is misleading. A world-class MTTR can be under 2 hours, and for general manufacturing, a common practical benchmark is to stay under 5 hours, although the exact figure depends on the type of equipment and the complexity of the repair.
A CNC machine with proprietary numerical control and a server with standard parts are not comparable: the former may need manufacturer support, while the latter can be replaced with a warehouse spare in minutes.
Practical rule: the MTBF/MTTR ratio matters more than the absolute values. As a general reference, a ratio above 200 usually indicates a healthy system, a ratio between 50 and 200 suggests room for improvement, and a ratio below 50 points to an asset that consumes a disproportionate amount of the maintenance team’s time.
Before setting a target, normalize by actual operating hours and asset criticality. A machine that runs only 4 hours a day should not be compared with one that operates across three shifts: its exposure to wear is different, and the benchmark should be adjusted accordingly.
Practical measures to reduce MTTR in a few months
Reducing MTTR is a quick win: it does not require redesigning machines; it requires organizing the response process.
-
Move critical spare parts closer. Identify which parts cause the most hours of waiting and place them physically near the asset, not in a central warehouse 20 minutes away.
-
Standardize procedures with checklists. A repair documented step by step prevents each technician from improvising their own method and reduces variability in repair times.
-
Train and rotate technicians to achieve “first-time fix.” Every repeat intervention caused by an incorrect diagnosis doubles the total downtime.
-
Redesign for easier access. Panels with standard fasteners, accessible test points, and manuals visible on the machine itself save minutes at every stage.
-
Use a system that prioritizes and guides the intervention. A CMMS that displays breakdown history and spare-parts locations prevents technicians from wasting time searching for information before taking action.
Professional tip: Measure MTTR by phase for a quarter before investing in anything.
Strategies to increase MTBF in the medium and long term
Increasing MTBF is a program, not a one-off action. It requires understanding why equipment fails, not just repairing it faster when it does.
-
Root cause analysis of recurring failures. If the same pump fails for the same reason every two months, the problem is not the repair; it is the installation design or an incorrectly adjusted operating parameter.
-
Condition-based maintenance. Vibration, temperature, or electrical consumption sensors make it possible to intervene before a failure occurs instead of reacting afterward.
-
Review specifications with the manufacturer (OEM). Sometimes equipment operates outside its design parameters, and the supplier may recommend adjustments that reduce wear.
-
Adjust preventive maintenance plans. Periodically reviewing intervention intervals prevents both over-maintenance and under-maintenance, which are both costly.
-
Coordinate with production planning. An MRP planning module that distributes the workload among machines prevents one machine from always working at its limit while another is underused—something that unnecessarily accelerates wear on the first machine.
Improving MTTR is tactical. Improving MTBF requires root cause analysis and sustained engineering work, and results take months to appear, not weeks.
How a CMMS/MES makes it easier to measure and improve MTTR and MTBF
A maintenance management system automatically captures data that used to live on paper work orders: alert time, diagnosis start time, spare-part arrival time, and closeout time. This phase-by-phase record is exactly what makes it possible to calculate MTTR and MTBF without relying on guesswork.
Digital workflows reduce waiting times in tangible ways:
-
Automatic alerts when a condition sensor detects a deviation, before a failure occurs.
-
Breakdown history by machine that speeds up diagnosis on a second visit for the same problem.
-
Visibility into critical spare-parts stock linked directly to each asset, so no time is wasted looking for where a part is.
-
Work orders prioritized according to equipment criticality, preventing a minor breakdown from blocking the schedule for a major one.
An MES integrated with production control also cross-references downtime data with actual production data, making it possible to distinguish a mechanical failure from a simple wait for materials. That distinction is what separates reliable MTBF from MTBF inflated by causes unrelated to the equipment.
Priorities and roadmap: when to tackle MTTR and when to tackle MTBF
If your team spends its time putting out fires, start with MTTR: poorly positioned spare parts and a lack of checklists can be fixed in weeks. But watch out for a common mistake: reducing MTTR without increasing MTBF can mask a reliability problem and turn your team into experts at quickly repairing things that should never fail so often.
A reasonable roadmap sets quarterly MTTR targets (reducing spare-part waiting times, training technicians) while simultaneously launching a 1-to-3-year program focused on root cause analysis and condition-based maintenance. Neither metric stands on its own.
Bold Factory is an alternative to building your own tracking system in Excel: its CMMS module automatically records each phase of an intervention (alert, diagnosis, waiting for a spare part, repair, verification), so MTTR and MTBF are calculated automatically by asset and asset class, without anyone having to manually enter hours at the end of the shift.
The MES cross-references these downtime periods with actual production data, and the platform’s artificial intelligence agents automate alerts and work-order prioritization through natural-language instructions, with no programming required. Everything is implemented in days, with no long-term commitment required and an interface designed for any operator to use on a mobile device on the plant floor.
If you manage a small or medium-sized industrial business and want to see these calculations applied to your own assets, request a demo to see what your actual availability looks like in the first few weeks of use.