Production KPIs: What to Measure First and How to Avoid Common Mistakes

2026-08-11

A production KPI is a quantifiable metric that links a plant’s actual performance to a predefined operational objective. If you’re starting today, first measure OEE broken down into its three components, cycle time, downtime, first-pass yield (FPY), and work in progress (WIP). Before comparing one shift with another, establish the data dictionary and assign an owner to each indicator: without that foundation, any dashboard creates more noise than decisions.
In brief:
Measuring OEE broken down into availability, performance, and quality is key to accurately identifying operational losses.
Prioritizing KPIs such as FPY and the rejection rate helps reduce the cost of poor quality, especially if the goal is to improve profitability.
Effective implementation requires defining an owner, data dictionary, baseline, and corrective actions with closed-loop follow-up to prevent the data from being useless.
Using integrated MOM platforms makes it possible to capture data in real time and automate alerts, accelerating decision-making and continuous improvement.
It is advisable to focus on a few relevant KPIs based on the quarter’s strategy, avoiding isolated metrics that may contradict one another.
Table of contents
-
Key production KPIs: an explained list and practical formulas
-
How to select and prioritize KPIs: practical criteria and a decision matrix
-
Practical implementation in four phases: from definition to continuous improvement
-
OEE in depth: how to avoid misinterpretations and break down losses
-
Reliable measurement: data quality, segmentation, and a minimum capture architecture
What is a production KPI, and why should you classify it?
A production KPI is not just any data that comes from a machine. It is a measure that connects a plant’s actual performance to a business objective, and is used to diagnose, control, and correct—not just to file away in a monthly report. The ISO 22400 standard formalizes this idea with common formulas and units so that two plants, or two shifts in the same plant, speak the same language when comparing results.
The standard organizes data into three levels. First are raw measures: downtime minutes, units produced, rejected parts. Next come basic KPIs, which express a relationship (availability, rejection rate, cycle time). Finally, there are composite KPIs, such as OEE, which combine several basic KPIs into a single management figure.
It is also useful to classify by functional category: production (rate, quantity), quality (rejections, rework), maintenance (downtime, time between failures), and inventory (WIP, turnover). ISO describes these indicators as a common management language, not as a closed list of targets; each plant decides which combination matters to it based on its context and unit of work. That flexibility is an advantage, but it also calls for good judgment: measuring everything measurable without a hierarchy is as useless as measuring nothing.
Key production KPIs: an explained list and practical formulas
Each indicator answers a different operational question. Reviewing them separately, with their formulas and the right interpretation, helps avoid the most common mistake: looking at an isolated number without understanding what drives it.
OEE (overall equipment effectiveness). It is calculated as availability × performance × quality, and you can explore its calculation in more depth with the practical guide to calculating OEE and examples. A moderate OEE says nothing by itself if you don’t know which of the three factors is holding it back. Breaking it down is mandatory, not optional, and we cover it in detail in the next section.
Cycle time and takt time. Cycle time is how long your process actually takes to produce one unit. Takt time is different: it is calculated by dividing available time by customer demand, and sets the pace at which you should produce to avoid building up excess inventory or creating bottlenecks. According to the Lean Enterprise Institute, confusing these two concepts is one of the most common mistakes at plants getting started with Lean: if your cycle time exceeds takt time, you are creating delays; if it is comfortably below takt time, you are probably overproducing.
Downtime. Not all stops have the same impact. Micro-stops (under five minutes, often not even recorded) tend to add up to more cumulative loss than long, visible stops. Classify downtime by type: mechanical failure, changeover, material shortage, scheduled stop. Without that classification, the data only confirms that something failed, not what failed.
FPY (first-pass yield) and rejection rate. FPY measures what percentage of units come out correctly the first time, without rework. The rejection rate is its inverse complement, but with a caveat: a reworked part does not count as a rejection, even though it has consumed extra resources. Distinguishing between the two prevents the true cost of poor quality from being hidden.
WIP (work in progress) and inventory turnover. Growing WIP almost always indicates a downstream bottleneck, not excess capacity upstream. Monitoring it alongside inventory turnover helps distinguish whether the problem is one of flow or purchasing plans.
Cost per unit and OTIF (on time and in full). Cost per unit combines materials, labor, and overhead per item produced; it is the indicator that ultimately connects the plant to the income statement. OTIF measures whether the customer received what was agreed, when it was agreed, with nothing missing.
Other complementary indicators worth keeping an eye on:
-
Utilization: the percentage of total time that the equipment is actually producing, compared with theoretical available time.
-
TEEP (total effective equipment performance): similar to OEE, but calculated over 24 hours a day; useful for evaluating actual idle capacity.
-
Labor efficiency: standard hours compared with actual hours worked per unit produced.
-
Energy consumption KPI: the ISO 22400-2:2014/Amd 1:2017 amendment incorporates energy indicators that should be related to good units produced, not operating hours, so that the data makes business sense.
How to select and prioritize KPIs: practical criteria and a decision matrix
You don’t need to measure all fifteen indicators above from day one. You need to measure the three or four that actually move your objective for this quarter, and do it well.
The starting point is alignment: if your priority is reducing the cost of poor quality, FPY and the rejection rate matter more than OTIF. If the problem is customer service, it’s the other way around. A dashboard that mixes objectives without a hierarchy forces you to choose between indicators that sometimes pull in opposite directions, as noted in reference work on measuring plant performance: improving speed can worsen quality if you don’t monitor both at the same time.
To decide which KPIs to prioritize, apply these four criteria:
-
Relevance: Is the indicator directly linked to a current business objective, or is it a nice-looking figure with no consequences?
-
Actionability: If the number gets worse, is there a clear action someone can take within 24 or 48 hours?
-
Capture cost: Can you obtain the data with what you already have, or does it require investment in new sensors or processes?
-
Reliability: Is the data source consistent from shift to shift, or does it depend on someone writing it down by hand whenever they remember?
A simple impact-versus-capture-ease matrix helps visualize this: broken-down OEE usually falls into high impact and medium ease (it requires a certain level of recording discipline, but no complex technology); exact cost per unit is usually high impact but difficult to capture, because it combines data from several systems.
Professional tip: avoid the mistake of optimizing a single KPI in isolation. An operator under pressure to focus only on volume will tend to sacrifice quality without anyone noticing until returns start coming in. Indicators should always be read in pairs: production with quality, speed with maintenance.
Practical implementation in four phases: from definition to continuous improvement
Rolling out production indicators without a method is why so many factory dashboards end up abandoned after three months. The NIST describes a practical four-phase rollout that can be applied directly to an industrial SME, without requiring a project that takes years.
-
Set objectives and assign owners. Before touching any spreadsheet, decide which business problem you want to solve and who owns each KPI. Without an owner, there is no follow-up.
-
Define the data dictionary and formulas. Lock down the definitions: what counts as a stop, what counts as a rejection, and what time unit you use. This dictionary must not change during the comparison period, even if it is tempting to adjust it when a number looks bad.
-
Establish a baseline and configure data capture. Measure for one or two weeks before setting numerical targets. Configure capture by shift, day, and week, not just as a monthly aggregate.
-
Review deviations, code causes, and verify actions. Each deviation needs a coded cause, a target correction date, and a later check to make sure the action worked.
To get started on day one, these practical tools make the difference between a KPI that is tracked and one that is forgotten:
-
A data dictionary template listing inclusions, exclusions, units, and the owner of each metric.
-
A shift capture form that an operator can fill out in under a minute.
-
A visual panel on the plant floor (physical or digital) showing the day’s KPI against the target.
-
A corrective action log with the cause, owner, and closure date.
The detail that determines whether this works or stays on paper is simple: every deviation must have an owner, a coded cause, a target date, and subsequent verification, as NIST itself notes in its operations-driven measurement framework. A KPI without this closed loop is just a decorative number.
OEE in depth: how to avoid misinterpretations and break down losses
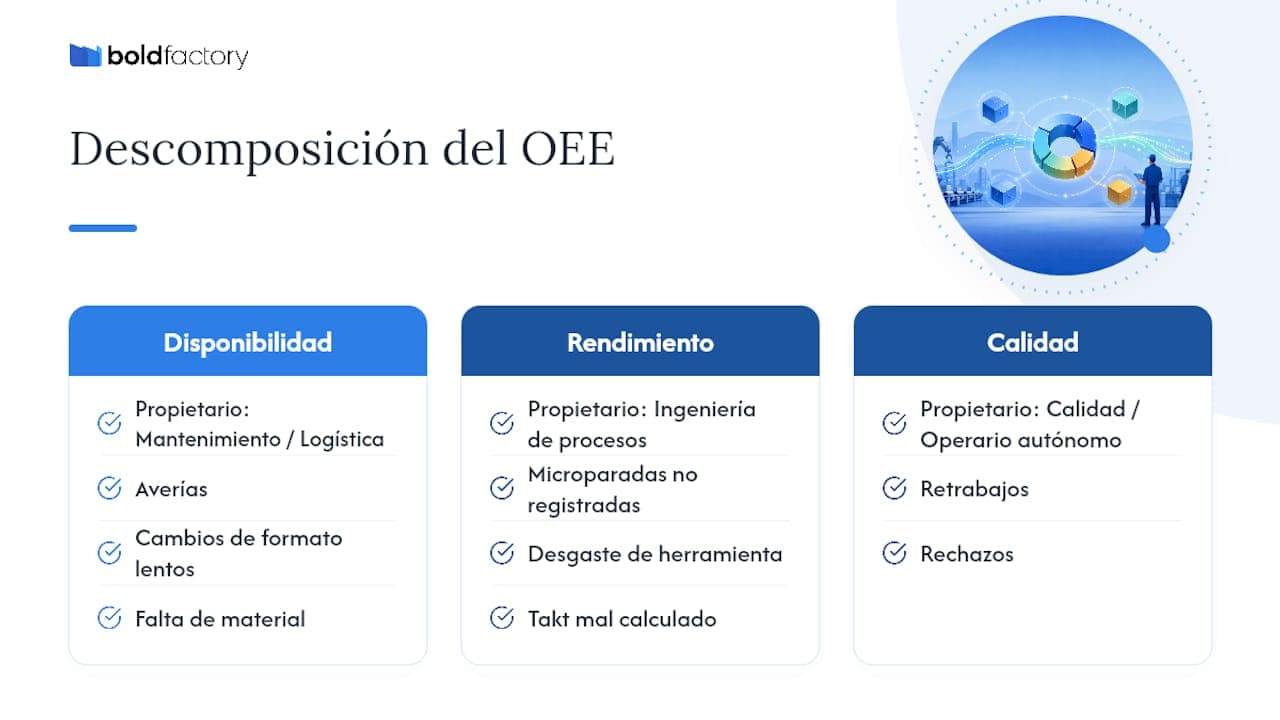
The formula is availability × performance × quality, and each factor points to a different department.
Availability falls because of breakdowns, slow changeovers, or material shortages: maintenance or internal logistics is the natural owner here. Performance (actual speed versus theoretical speed) often points to unrecorded micro-stops, tool wear, or incorrectly calculated takt time: this is where process engineering comes in. Quality points to rework and rejects, and its natural owner is the quality manager or the operator, if they have the autonomy to adjust parameters.
A case documented by NIST involving a hydraulic press illustrates this well: before data capture was automated, calculating OEE accurately was practically impossible because short stops were not recorded. By automating timestamps, the plant was finally able to see which OEE component was actually failing, instead of making assumptions.
When OEE falls, the right question is not “Why did OEE fall?” but “Which of the three factors fell, and why?” Prioritizing actions across maintenance, quality, and planning requires looking at the breakdown, not the composite number.
For visualization, avoid relying on a single monthly average: a dashboard showing OEE by shift and machine, with alerts when a component falls below a threshold, makes it possible to act the same day instead of discovering the problem at month-end.
Reliable measurement: data quality, segmentation, and a minimum capture architecture
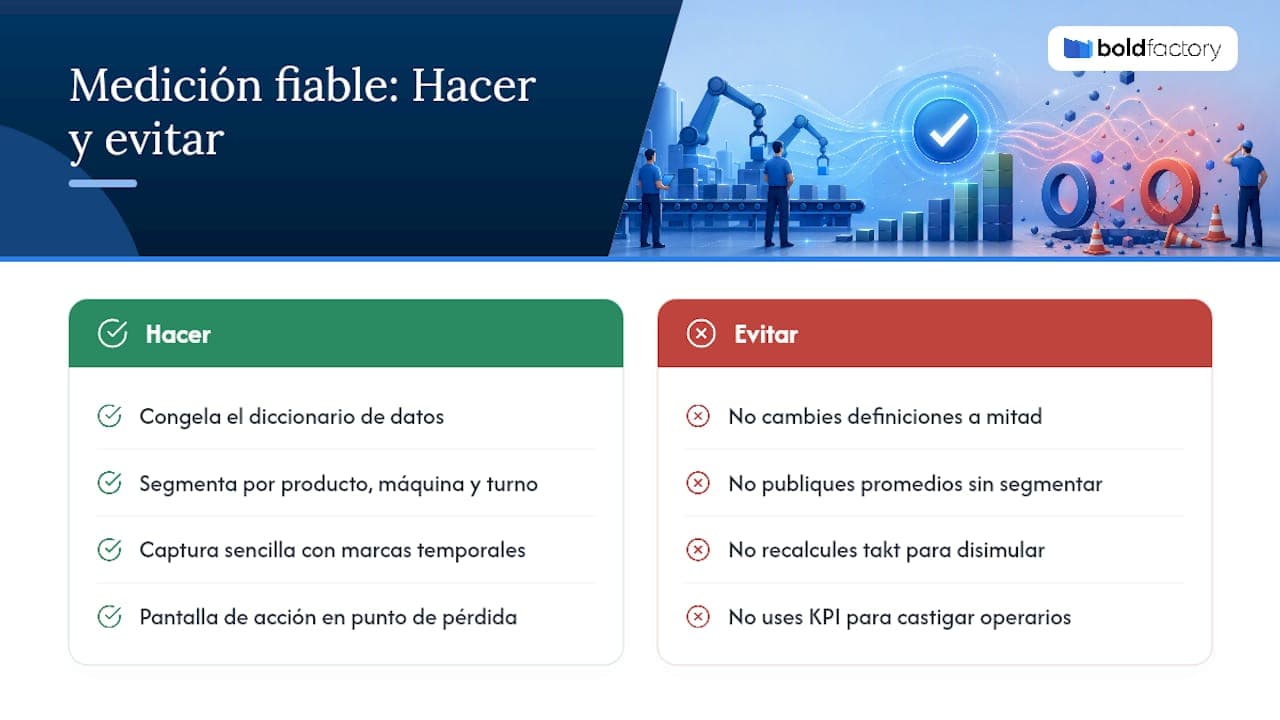
The most common trap in production KPI measurement is not a lack of data, but changing its definition halfway through. Before comparing one shift with another, you need to lock down the data dictionary, including its inclusions, exclusions, unit, and owner, as recommended by the ISO 22400 framework itself. If you count micro-stops in March and stop counting them in April, the “improvement” you see in the chart is statistical fiction, not real improvement.
The second trap is measuring an average when reality is heterogeneous. A plant that makes twenty different products and publishes a single monthly OEE is hiding which product, machine, or shift is concentrating the problem. Segmenting by product family, machine, and shift is the only way to make the data point to a specific action rather than a general impression.
The most useful architecture combines simple capture by the operator, automatic timestamps where possible, and an action screen right where the loss occurs, to speed up correction instead of waiting for the weekly report.
At high-mix, low-volume plants, the Lean Enterprise Institute recommends reviewing takt time when the product mix or demand changes, but never recalculating it to disguise a real operational problem. Adjusting takt so the number “adds up” is the most subtle way to manipulate measurement.
Professional tip: never turn the KPI into a direct punitive system against the operator. If every negative data point ends in a reprimand, people stop recording actual stops, and the data becomes useless precisely when you need it most.
How an MOM platform accelerates KPI measurement and use
Everything above requires disciplined data capture, and that discipline tends to fail when it depends on paper production reports or Excel sheets that someone updates manually at the end of a shift. There are systems that bring together plant data capture, the KPI dictionary, and the dashboard in a single system that an operator can use from a tablet, without extensive training or an implementation project lasting months.
Platforms such as Bold Factory can be deployed in just a few days with no mandatory long-term commitment, which is especially useful for industrial SMEs with between 5 and 100 operators that want to digitize OEE broken down by shift without large, costly projects. The production control module (MES) captures cycle times, stops, and rejects in real time, while integration with maintenance (CMMS) and planning and purchasing lets you close the full loop: from a detected deviation to a verified corrective action, without switching systems or re-entering data manually.
In the specific case of Bold Factory, the tool has artificial intelligence agents that automate repetitive tasks through natural-language instructions, useful for coding stop causes or generating alerts when an OEE component falls below a threshold. If you manage a discrete manufacturing plant (metal, machining, furniture, textiles, or packaging) and want to move from spreadsheets to a real dashboard, you can review the plans and prices (from €300/month) or check API integration with your ERP before deciding.
Sources
The standards and practical cases supporting this article make it possible to explore each indicator with technical rigor, not just good intentions:
-
NIST — Operations-driven performance measurement (Smart Manufacturing Systems)
-
ISO 22400-2:2014 - KPIs for manufacturing operations management
-
NIST report — Assessment of Real-Time Factory Performance (MRED / QIF discussion)
-
Lean Enterprise Institute — Ask Art: Why is Takt Time So Important in a Lean Turnaround?
Frequently asked questions
What are the KPIs in production?
The most common production KPIs are OEE broken down into availability, performance, and quality; cycle time; downtime; FPY; rejection rate; WIP; inventory turnover; cost per unit; and OTIF. Their combination depends on each plant’s business objective, as set out in the ISO 22400 framework.
What are the seven productivity indicators?
There is no universal, fixed list of seven indicators, although many plants converge on a similar set: OEE, cycle time, downtime, FPY, WIP, cost per unit, and OTIF cover production, quality, maintenance, and inventory at the same time. The exact combination should be tailored to your objectives, not copied from another factory.
What are a product’s KPIs?
At the product or item level, the most useful indicators are that item’s specific rejection rate, actual cycle time versus the standard, cost per unit, and FPY. Segmenting these data by item prevents an overall average from hiding problems concentrated in a particular product.
What are production indicators?
Production indicators measure the quantity, pace, and efficiency of the manufacturing process: units produced per hour, cycle time, takt time, machine utilization, and OEE are the most commonly used. Tools such as Bold Factory’s MES make it possible to capture these data automatically by shift instead of collecting them manually at the end of the day.