Shrinkage Control: The Operational Action That Protects Your Margin

2026-05-26

Shrinkage control means measuring where losses occur (receiving, portioning, and production) and giving them their own line in your management P&L so they become a manageable variable. The immediate priority is to apply double weighing to the ten highest-cost ingredients for seven days. That record in euros, not just kilograms, is what makes it possible to make real decisions about purchasing and processes.
In summary:
Shrinkage must be measured by double weighing the most expensive ingredients for seven days to obtain accurate data in euros and kilograms.
Classifying shrinkage by type makes it possible to assign specific responsibilities, enabling effective interventions in processes, storage, and handling.
Implementing a digital system with mobile logging, alerts, and traceability can reduce losses by 30% to 60% in the first six months.
Setting recipe costings, training staff, and controlling inventory rotation are key actions for reducing technical and operational shrinkage.
Measuring early, in the first few days, quickly reveals root causes, helping prioritize actions and accelerate loss reduction.
Table of Contents
-
Types of Shrinkage: A Practical Taxonomy for Assigning Responsibility
-
How to Measure and Calculate Shrinkage (Practical Methods and Essential KPIs)
-
Root Cause Analysis and Operational Diagnosis (Where to Look First)
-
Practical Strategies for Reducing Shrinkage in Operations and Production
-
A 4-Week Implementation Plan: Diagnosis, Standardization, Logging, and Action
-
The Author's Perspective: Practical Lessons Learned in Operations
What Shrinkage Is and Why It Matters for Profitability
Shrinkage and waste are not synonyms. Shrinkage is the loss of quantity or quality of a product during handling, storage, or processing, while waste also includes avoidable decisions such as overproduction or human error, according to the general taxonomy set out on Wikipedia. Confusing the two concepts leads to underestimating the true cost.
The cost of shrinkage is never just the lost ingredient. It includes the labor spent handling it, the energy used to store or cook it, and the cost of disposing of it. Combined, these factors often double or triple the purchase value of the lost product.
In Spain, Law 1/2025 on the prevention of food loss and waste requires businesses in the food supply chain to systematically measure and prevent these losses as part of the national plan. This makes shrinkage control a regulatory obligation, not just good management practice.
The most common hidden costs are:
-
Ingredient or raw material lost at the source.
-
Staff hours spent handling products that end up being discarded.
-
Energy wasted on refrigeration, cooking, or production.
-
Logistics and waste-disposal costs.
Types of Shrinkage: A Practical Taxonomy for Assigning Responsibility
Classifying shrinkage by type makes it possible to assign a specific owner instead of spreading the loss across departments. Each category requires a different intervention.
-
Natural shrinkage: an unavoidable loss of weight or volume due to evaporation, oxidation, or physical handling. It falls under the responsibility of storage and production, and its potential for reduction is limited.
-
Technical or process shrinkage: shrinkage that occurs during processing (cutting, cooking, packaging). The natural owner is the production or kitchen team.
-
Operational or avoidable shrinkage: human error, overproduction, or poor handling. The shift supervisor is directly responsible.
-
Expiration- or storage-related shrinkage: products lost due to poor stock rotation or inadequate storage conditions. This falls under the responsibility of storage and purchasing.
-
Administrative or internal-consumption shrinkage: inventory discrepancies, internal consumption, or incorrect logging. Its control falls to administration and cost control.
Tagging each daily record with its type, not just the quantity lost, is what makes it possible to conduct a useful analysis by area and shift.
How to Measure and Calculate Shrinkage (Practical Methods and Essential KPIs)
Double weighing is the standard method: weigh the ingredient upon receipt, weigh it again after portioning or preparation, and divide the difference between the two weights by the initial weight to get the shrinkage percentage. Measuring only at the end of the process, instead of at the three critical points (receiving, portioning, and production), is the most common mistake and the one that prevents you from locating the root cause.
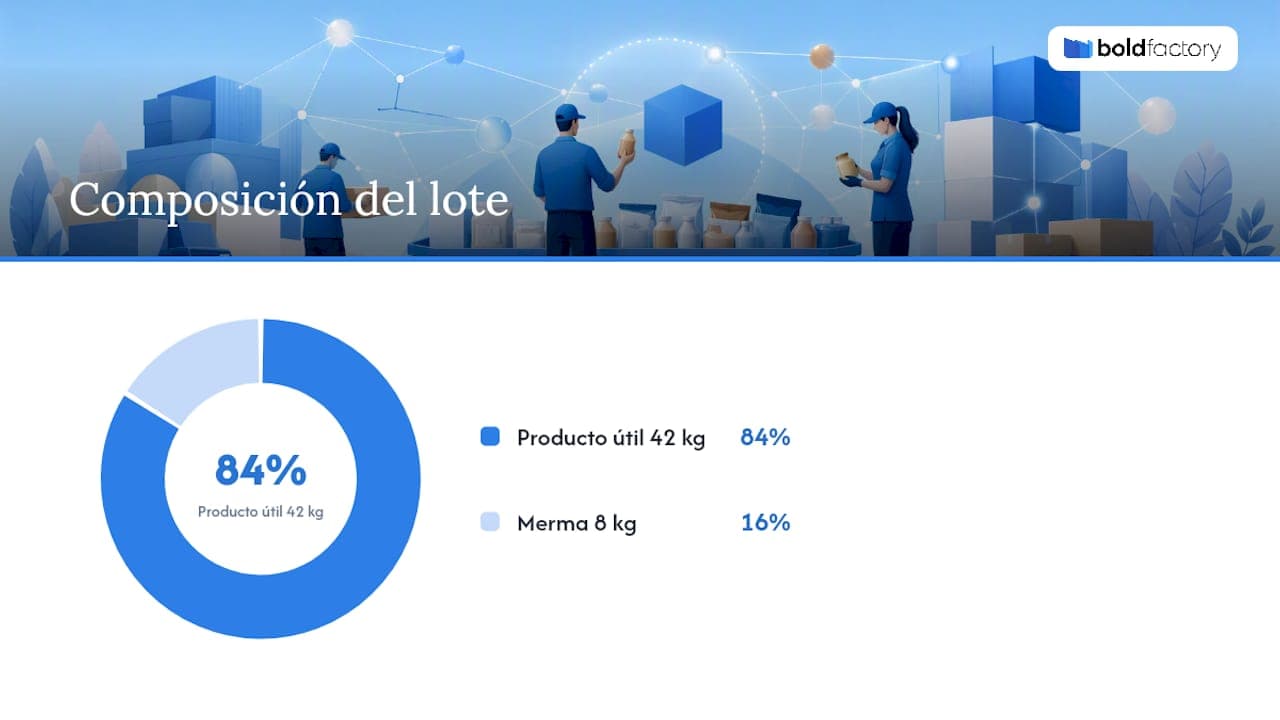
The basic formula is: % shrinkage = (initial weight − final weight) / initial weight × 100. If you receive 50 kg of a product and obtain 42 kg of usable product after portioning, your shrinkage is 16%. Comparing that figure against a reference percentage for each ingredient, a practice that kitchen operations guides recommend as standard, reveals whether the variance is normal or requires intervention.
Professional tip: always record the weight in the same unit and at the same time during the shift; comparing weights taken at different times distorts the actual percentage.
The indicators that really matter to management are:
-
Shrinkage percentage by ingredient, compared against the historical or reference range.
-
Shrinkage cost in euros as a proportion of total sales for the period.
-
Variance between theoretical and actual food cost.
-
Yield efficiency rate per production batch.
Key fact: implementing systematic logging with a regular review cadence can reduce losses by 30% to 60% in the first six months when the analysis is accompanied by real corrective actions, not just reports.
Measurement frequency depends on how critical the ingredient is: daily for the highest-cost or fastest-moving items, and weekly for the rest.
Root Cause Analysis and Operational Diagnosis (Where to Look First)
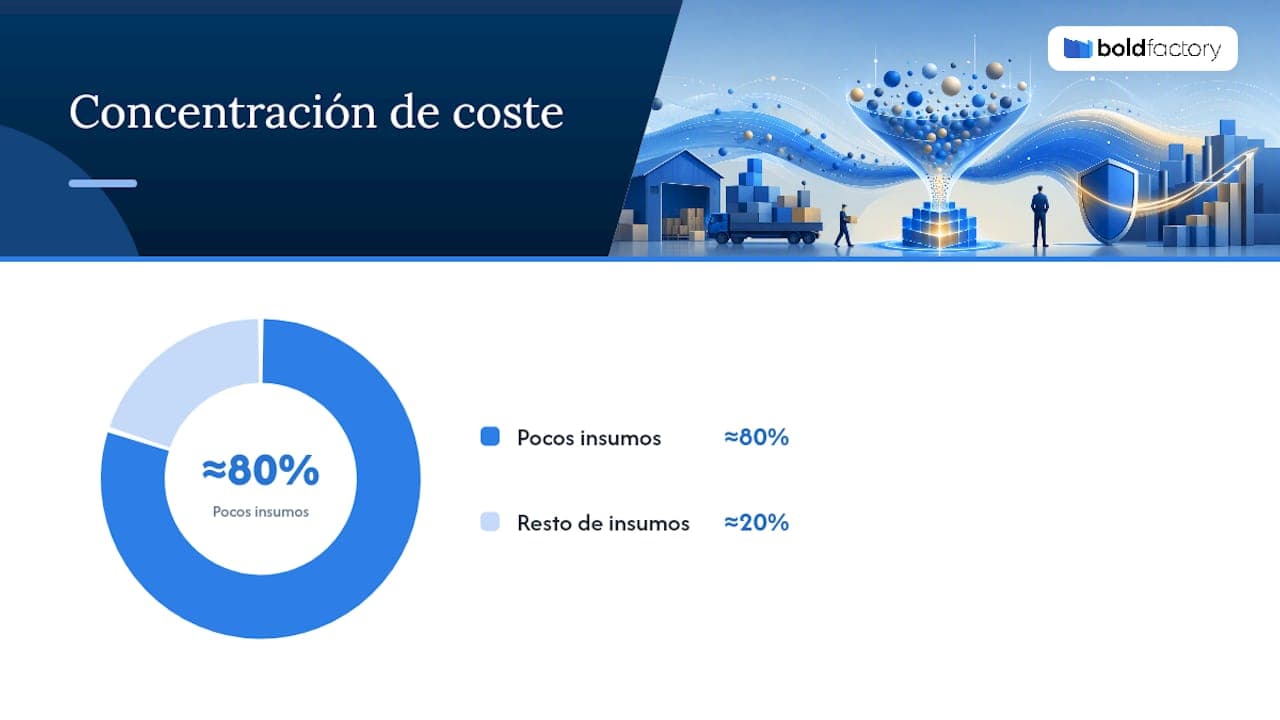
Before launching a general action plan, break shrinkage down by product, shift, and day. The 80/20 rule almost always holds in operations: a handful of ingredients account for most of the cost of losses, and that is where the initial effort should go.
The yield test measures how much usable product you get from a purchased unit after cleaning, cutting, or cooking. Conducting it monthly on critical ingredients makes it possible to renegotiate purchasing based on data, not intuition.
Common measurement errors include comparing batches from different suppliers as if they were identical, failing to record shrinkage by shift, and confusing natural shrinkage with operational error. Assigning a clear owner for each type of shrinkage, not just for each area, prevents losses from being left without an owner.
-
Start by segmenting by cost, not volume: the most expensive ingredient is rarely the most voluminous.
-
Always conduct the yield test under comparable conditions (same supplier, same batch, same method).
-
Record the probable cause at the time of measurement, not at the end of the day.
Professional tip: if two shifts show very different shrinkage for the same product, the problem is almost never the ingredient: it is the procedure or the training on that shift.
Practical Strategies for Reducing Shrinkage in Operations and Production
Reducing shrinkage requires intervening on five fronts at once, following the recommendations in The Do’s and Don’ts In Metal Parts Designing, not just one.
-
Purchasing based on yield: negotiate with suppliers using the cost per usable kilogram, not the cost per gross kilogram. A well-documented yield test is your best argument at the negotiating table.
-
Storage control: apply FIFO rotation, inspect packaging, and control cold-room temperatures. Shrinkage due to expiration is usually the easiest to eliminate and the most overlooked.
-
Process standardization: set exact recipes and recipe costings, with portion control verified periodically. Human variability in portioning is a recurring cause of technical shrinkage.
-
Four-week forecasting: link production to a sales forecast, not to habit. Producing more than actual demand is the most expensive way to generate avoidable shrinkage.
-
Training and governance: train staff on the reasons behind each procedure and tie shrinkage reduction targets to each area's management P&L.
The reduce, reuse, and recycle framework, widely used in shrinkage management, puts prevention ahead of any downstream solution. Reusing by-products or donating surplus makes sense only when reducing at the source is no longer possible.
Professional tip: before buying more cheaply, calculate that supplier's actual yield. A low price with poor yield almost always costs more than a high price with consistent yield.
Tools and Digitalization for Shrinkage Control
A paper log or a scattered spreadsheet rarely survives more than a few weeks of real-world use on the plant floor. Operations managers need a tool with quick digital logging, costs automatically calculated in euros, alerts when an ingredient exceeds its reference threshold, and reports broken down by shift.
This is where manufacturing infrastructure comes in: a production control system connected to purchasing and storage detects yield variances as they occur, not weeks later during the accounting close. A traceable warehouse module reduces expiration-related shrinkage by enforcing actual FIFO rotation, and a maintenance system such as a CMMS reduces technical shrinkage associated with machine stoppages or process failures.
A platform brings these functions together and adds artificial intelligence agents that automate repetitive shrinkage logging using natural-language instructions, without the need for custom development. Most teams that digitize this process begin to see visible results in shrinkage percentages between weeks 8 and 12.
-
Logging from the plant floor, without relying on spreadsheets.
-
Shrinkage costs automatically calculated in euros by ingredient and shift.
-
Automatic alerts when the reference threshold is exceeded.
-
Connected traceability across receiving, storage, and production.
A 4-Week Implementation Plan: Diagnosis, Standardization, Logging, and Action
A four-week plan is enough to move from intuition to data.
-
Week 1: apply double weighing to the ten highest-cost ingredients and start a daily logbook.
-
Week 2: set exact recipe costings for each recipe or process and train the team on the measurement procedure.
-
Week 3: continue daily logging and hold a weekly review with the people responsible for each shift.
-
Week 4: define specific corrective measures, agree on reduction targets with each area, and establish ongoing monitoring.
| Week | Main deliverable | Owner |
|---|---|---|
| 1 | Double weighing of critical ingredients | Storage / production |
| 2 | Recipe costings set and team trained | Shift supervision |
| 3 | Daily logging and weekly review | Operations manager |
| 4 | Targets agreed and monitoring plan | Management |
Indicators for Medium-Term Monitoring and Internal Audit
The weekly review should prioritize the shrinkage percentage for each critical ingredient and its cost in euros; the monthly review adds food cost variance and the cumulative trend by area.
-
Review the highest-cost ingredients weekly and the rest of the catalog monthly.
-
Trigger a 48-hour audit when the variance exceeds 1.5 percentage points compared with historical data.
-
Present shrinkage to management as a separate line in the management P&L, with its cost in euros and percentage of sales.
Key fact: including shrinkage as a systematic line in the management P&L provides immediate visibility to prioritize corrections according to their actual economic impact, rather than perception.
The most common trap is not measuring incorrectly; it is measuring too late. Start with the ten critical ingredients and measure for seven consecutive days before changing any process: the data from that first week is usually enough to show where the real problem lies.
An Integrated Platform to Accelerate Shrinkage Reduction
Moving shrinkage control from a spreadsheet to a real system changes how quickly you detect and correct variances. Bold Factory connects production, purchasing, storage, and maintenance on a single platform, with mobile logging designed so any operator can use it on their phone on the plant floor, without a long learning curve.
The difference compared with custom development is the speed of implementation: deployment takes days, with no long-term commitment. A traditional software project can take months to produce its first useful data point. The integrated artificial intelligence agents automate repetitive shift-by-shift shrinkage logging, and operations management regains daily visibility without relying on delayed manual reports. If you manage an industrial SME with between 5 and 100 operators and want to stop using Excel for shrinkage control, you can request a demo of Bold Factory's production control system and see how it connects to your storage and maintenance from day one.
Sources
-
BOE-A-2025-6597 Law 1/2025 of April 1 on the prevention of food loss and waste
-
Shrinkage management in restaurants: how to reduce losses — Kitchen Stocker
-
Shrinkage management 2026: mistakes vs. the correct method · Data
-
Kitchen Shrinkage Control: A Practical Guide for Restaurants | PANCA Blog
Frequently Asked Questions
What are the three main types of shrinkage?
The types most often cited in operations are natural shrinkage (unavoidable physical loss), technical or process shrinkage (during processing), and operational or avoidable shrinkage (due to human error or overproduction). Expiration-related and administrative shrinkage are often added to these.
What exactly is meant by shrinkage?
Shrinkage is the loss of quantity or quality of a product during handling, storage, or processing, according to the general definition available on Wikipedia. It should not be confused with waste, which includes avoidable decisions.
What is the shrinkage KPI?
It is the indicator that measures the percentage of loss against an ingredient's initial weight or value, together with its equivalent cost as a proportion of sales. Operations managers compare it against a reference range for each product to detect variances.
What percentage of shrinkage is considered acceptable?
There is no single percentage that applies to all ingredients: each product has its own reference range depending on its nature and process. What matters is comparing the actual figure against that historical range and triggering an audit when the variance exceeds 1.5 percentage points.
How often should I measure shrinkage?
The highest-cost or fastest-moving ingredients should be measured daily; the rest can be reviewed weekly. This cadence, combined with systematic logging, makes it possible to reduce losses sustainably in the first months of implementation.