Digital Andon: a rapid pilot and minimum architecture for SMEs

2026-04-14

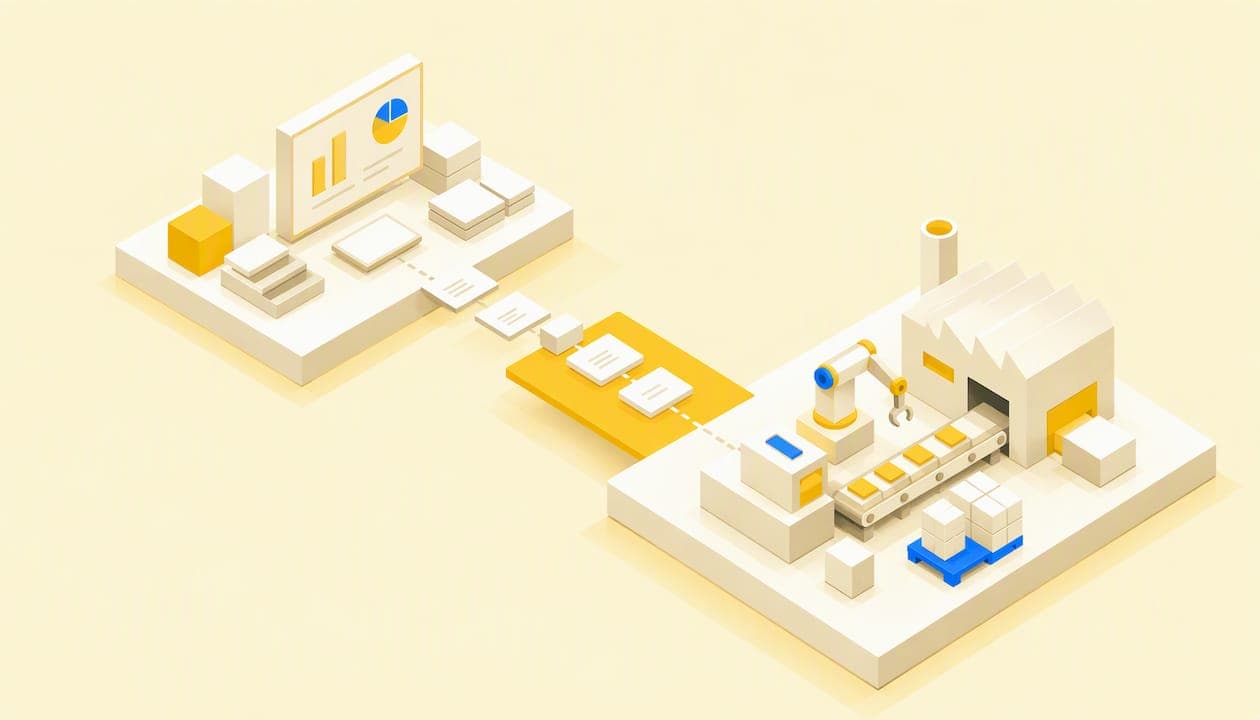
Digital Andon is a visual management system that replaces mechanical lights and cords with sensors, connected dashboards, and software that detects, notifies, and records every stoppage or anomaly in real time. Its immediate benefit is twofold: complete visibility into the line’s status and a measurable reduction in downtime. The value increases when it is connected to the plant’s MES or IIoT environment.
In brief:
In plants with clean data and stable KPIs, predictive analytics in digital Andon adds value, but it will not improve decisions without a sufficient volume of information.
The quick and straightforward implementation of a unified system such as Bold Factory avoids lengthy development and automatically connects alerts to work orders and planning.
Effective connections between sensors, visualization, and notifications reduce mean time to repair and improve communication between shifts, increasing production efficiency.
Installing only reliable sensors, defining clear response criteria, and managing cultural change are common challenges that can undermine a digital Andon deployment.
The digital system records every event along with its causes and durations, improving the accuracy of root cause analysis and assessments of the impact on overall equipment availability.
Table of contents
-
Digital Andon components and types: hardware, software, and hybrid systems
-
Technical architecture: how digital Andon works on the plant floor
-
Practical steps for implementing digital Andon on the plant floor
-
Common mistakes when deploying digital Andon and best practices
-
A straightforward alternative for deploying digital Andon without endless projects
What is Andon, and how did it evolve into its digital form?
The concept originated in Toyota’s production system, within the Jidoka pillar: any operator could pull a physical cord (the well-known andon cord) to stop the line when a defect occurred and activate a signal light. That logic remains in place, but the supporting technology has changed completely.
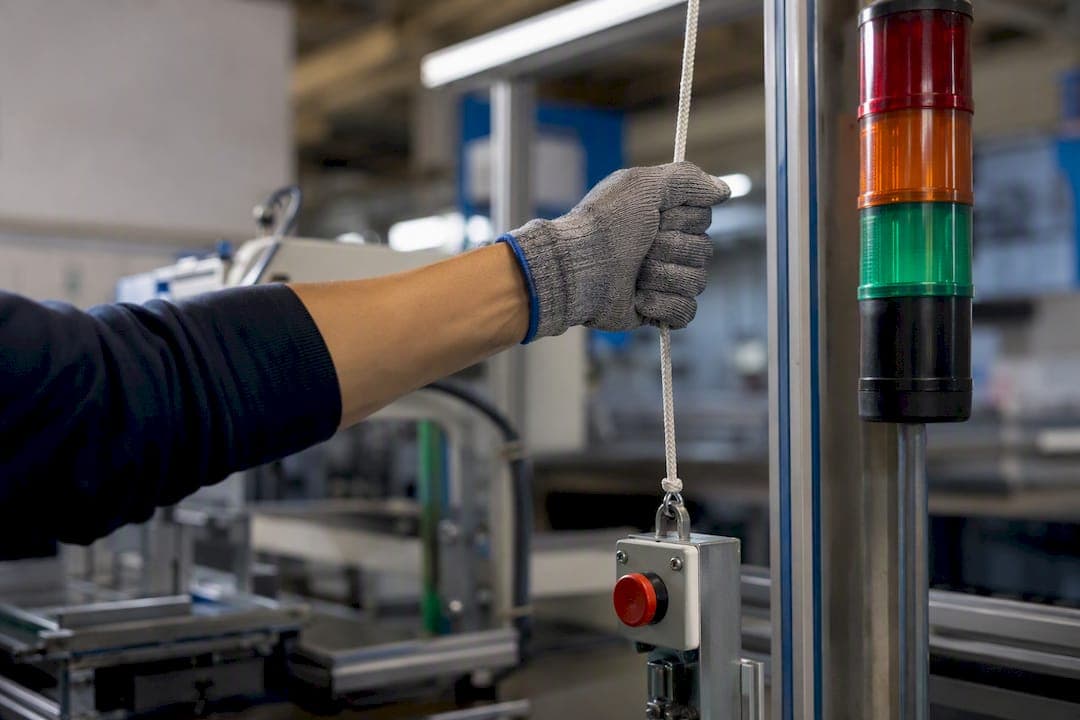
Traditional Andon relied on signal towers connected to a PLC and on a supervisor walking through the plant. Digital Andon replaces this manual monitoring with a centralized dashboard that collects alerts from across the plant and sends them to whoever needs to act, wherever they are.
A few practical differences mark this shift:
-
Traditional Andon alerts locally; digital Andon notifies the right person by screen, email, or mobile device.
-
Traditional Andon keeps no history; digital Andon records each event, including its duration and cause.
-
Traditional Andon requires a physical presence; digital Andon makes it possible to monitor several lines from a single screen.
Some manufacturers already call this more advanced stage, with analytics and learning from the data generated, Andon 4.0.
Operational benefits and metrics improved by digital Andon
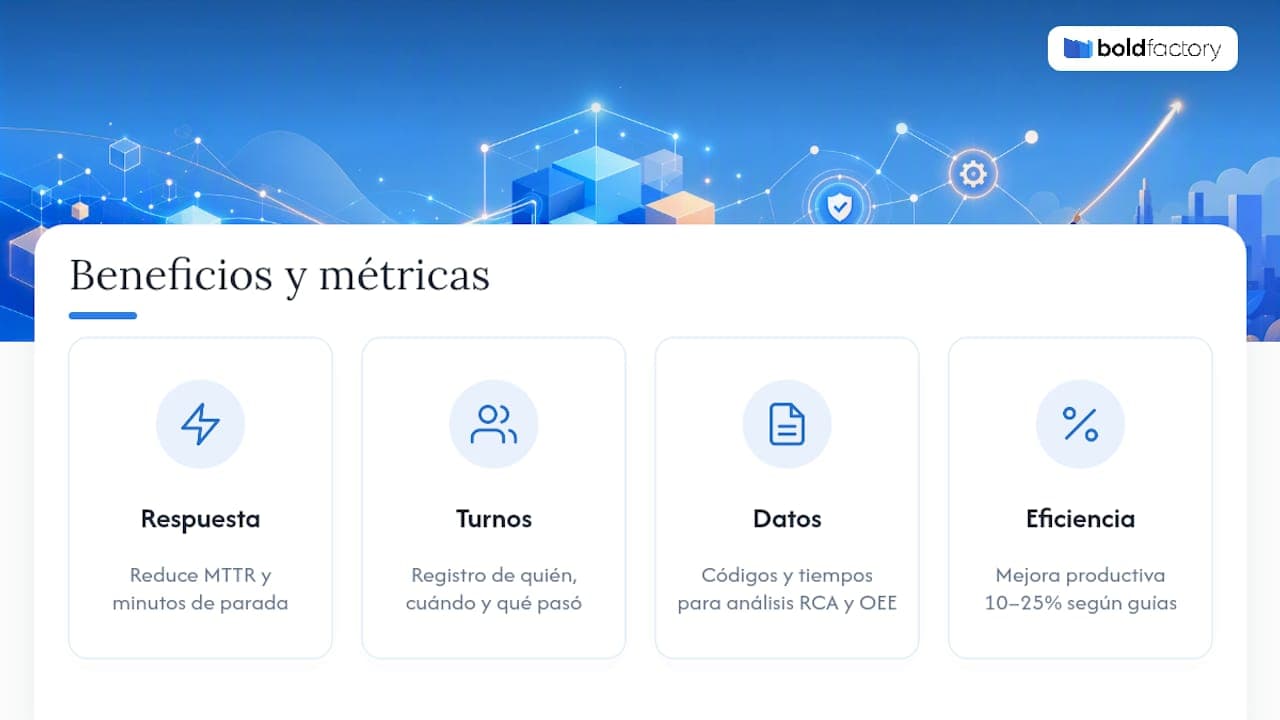
The first benefit is response time. When a machine stops, the system immediately sends an alert to the right person, without relying on someone noticing it in time. This directly reduces MTTR (mean time to repair) and cuts every minute of unplanned downtime short.
The second benefit is communication between shifts. A digital dashboard records what happened, when, and who responded, so the next shift does not have to repeat questions or lose context.
Key fact: Plants that combine visual management with Kaizen routines report production efficiency improvements of between 10% and 25%, according to industry guides.
The third benefit, and the most underestimated, is the quality of the data available for continuous improvement. Digital Andon makes it possible to assign a reason code to each event and record response times, turning every stoppage into an analyzable record. With this history, root cause analysis stops being guesswork and starts relying on real patterns, with a direct effect on OEE.
Digital Andon components and types: hardware, software, and hybrid systems
A complete system combines four essential components: machine sensors (or a cycle sensor that detects cycles and stoppages), an IoT or edge gateway that collects those signals, panels or screens that show status in real time, and a notification module that escalates the alert if no one responds in time. Integration with PLCs and protocols such as OPC UA is what connects this hardware to the rest of the factory.
By signal type, it is useful to distinguish three variants:
-
Light Andon: the classic color-coded signal tower, now connected to the network instead of only to the electrical panel.
-
Audible Andon: an audible alarm that complements the visual signal in environments with a lot of background noise or limited direct visibility.
-
Digital screen Andon: a centralized dashboard showing the status of several lines, timings, and assigned responders.
There is also a distinction between manual activation, using a cord or button pressed by an operator, and automatic activation, when a sensor detects the fault without human intervention. The combination of both is usually the most robust approach: sensors capture repetitive and predictable events, while operators report what no machine can detect on its own, such as a visual defect or an ergonomic problem.
Technical architecture: how digital Andon works on the plant floor
Any serious digital Andon system relies on five layers that are worth understanding before buying anything:
-
Acquisition: sensors, PLCs, and cycle sensors capture the event at its source: a stoppage, an out-of-time cycle, or a machine alarm.
-
Communication: the signal travels over the network to the central system. Here, it is worth using WebSockets or another low-latency protocol, with a reasonable target of less than two seconds between the event and its appearance on screen.
-
Processing: business rules (at the edge or in the cloud) determine the severity of the event and who it should be escalated to if there is no response within the set time.
-
Visualization: panels, plant-floor screens, and mobile notifications show the current status without anyone having to ask.
-
Analysis: the history of events, causes, and timings feeds OEE, MTTR, and failure-frequency reports.
These layers work together: without fast communication, visualization is not useful, and without processing based on clear rules, notifications arrive late or go to the wrong person.
Practical steps for implementing digital Andon on the plant floor
Deploying digital Andon does not require a project lasting months if it is structured well from the start.
-
Identify critical processes. Choose the machines or lines where a stoppage has the greatest impact on production, and define which metrics you want to improve: MTTR, number of stoppages, or response time.
-
Keep the pilot focused. A single line, with clear success criteria (for example, reducing average response time by 30% in four weeks), is enough to validate the approach before scaling up.
-
Choose the hardware and integration plan. Decide which sensors you need, how they will connect to the existing PLC, and how everything will integrate with your MES or ERP.
-
Define standard reasons and thresholds. Each type of stoppage needs a reason code and a maximum time before the alert is escalated to the next person responsible.
-
Deploy, train, and measure. Launch the pilot, train operators to use the system, and review the data generated before deciding whether to scale it across the rest of the plant.
Some practices are worth establishing from day one:
-
If you work with Lean methodology, document every significant stoppage using a Five Whys routine, not just a reason code.
-
Review which alerts recur and why each week, not just how many were generated.
-
Adjust escalation thresholds based on the pilot’s real-world experience, not the initial theory.
Common mistakes when deploying digital Andon and best practices
The most common mistake is measuring events that no one will act on. If an alert does not trigger a specific action, it only creates noise and erodes the team’s trust in the system.
The second mistake is failing to manage cultural change. A digital dashboard does not replace the responsibility to have someone respond on time: clear roles and explicit response times need to be assigned for each type of alert.
-
Avoid installing sensors without first validating that the alerts they generate are reliable.
-
Do not roll out the system across the entire plant without correcting the thresholds during the pilot.
-
Link critical alerts to the CMMS so they automatically generate a work order, closing the loop between detection and maintenance.
Professional tip: review the alert history every week during the first month.
How an MOM platform makes digital Andon frictionless
Most of the friction involved in implementing digital Andon does not come from the sensor, but from integration: connecting those alerts to production, maintenance, and purchasing often requires lengthy, expensive custom development. A manufacturing operations management (MOM) platform that already integrates production control, MRP, and CMMS avoids this problem at its root, because the alert is generated within the same system that manages work orders and planning.
This integration makes it possible for a stoppage detected on the plant floor to automatically become a corrective work order in the maintenance module, without exporting data between separate programs. For an industrial SME without a dedicated IT team, this simplicity often matters more than any advanced feature in a standalone Andon system.
Perspective: when to move to Andon 4.0
Moving to predictive analytics makes sense when there is already a sufficient volume of clean data and the basic KPIs (MTTR, response time) have been stable for months. Before then, adding artificial intelligence only adds complexity without improving decisions.
Setting up a functional digital Andon system should not mean months of custom development or relying on three different systems that never quite communicate with one another. Bold Factory brings production control, planning, warehousing, and maintenance together on a single platform, so stoppage alerts are already connected to work orders and purchasing plans, with no additional integrations to pay for.
The platform is implemented in just a few days, with no mandatory long-term commitment. Artificial intelligence agents can handle repetitive tasks using instructions in plain language, and the interface is designed for operators to use on mobile devices. If you manage a plant with between 5 and 100 operators and want to validate a visual management pilot connected to real production, you can request a demo of Bold Factory’s industrial production control software and see within a few days whether it fits your operation.
Sources
To learn more about color codes, sensor architecture, and OT/IT convergence, consult SGS Productivity, Vorne, Iter Digital, and IBM.