How to price your products: why cost plus margin is not enough

2026-11-12

The quote spreadsheet has eleven tabs, but the one that matters is the first. Materials, machining hours, treatment, packaging... and at the end of the column, a gray cell no one has touched in seven years: =SUMA(B4:B12)*1,3. That 1.3 has set the price for thousands of parts.
This is the way of setting prices repeated in practically every industry: calculate how much it costs to manufacture a product, add a profit margin, and send the quote to the customer. It seems logical. If we know our costs and know how much we want to earn, what could go wrong?
Quite a lot. The first problem is that many factories do not know precisely how much it costs them to produce. Manufacturing times are often estimates, rework is not always recorded, and downtime ends up diluted across overhead. If the starting cost is wrong, the price will be too.
But there is a second problem, and perhaps it is the more interesting one: even if we calculated our costs perfectly, we still would not know the best selling price. Cost tells us how much we need to recover. It does not tell us how much the customer is willing to pay, what the competition is charging, or whether that order is worth taking up our production capacity.
The two problems have something in common, and it runs through this entire article: in a factory, the price goes wrong first in the hours, not the percentage. The hours the part actually takes, and the hours it takes away from another job on the machine that cannot keep up with demand.
In summary
- Cost plus margin is a starting point, not a complete strategy. It tells us how much we need to recover, not how much the customer will pay or whether the order is worth taking up the machine.
- A cost breakdown with incorrect hours carries the error into the price. If the part quoted at four hours takes six, no percentage will fix it: it will just pass the error along.
- Adding 30% to cost is not the same as earning a 30% margin. It is a 23% margin on the selling price. To earn 30%, you need to divide the cost by 0.70, not multiply it by 1.30.
- Allocating fixed costs across what you sell this quarter raises the price just when demand is falling. The cost used for quoting should be calculated at normal capacity, which is also the criterion in Spanish accounting regulations.
- When the machine is full, the price floor is not the cost: it is what the hour you take away from another product would have contributed. Below that floor, accepting the order makes you lose money even if the margin is positive.
- The five calculations do not compete; they define a range. The price is decided within it, and how wide that range is depends on how much room there is on the critical machine.
What you will find here
- The problem with adding a margin to manufacturing cost
- Five different ways to calculate the price of a product
- Do not choose one method: put them all to work on the same part
- The data missing from many profitability calculations
- Sources
The problem with adding a margin to manufacturing cost
Imagine a company that makes custom metal parts to order. To prepare a quote, the person in charge checks the material cost, adds the expected machining hours, and applies a percentage to cover overhead and make a profit. So far, nothing unusual.
The problem appears when we compare that estimate with what actually happens on the factory floor. The part that was supposed to take four hours ends up taking six. There is a tool change, a wait for material, and an operation that has to be repeated because the first part does not meet the tolerances.
However, the next quote is calculated again using the original four hours.
The company is not setting prices based on its actual costs, but on what it thinks manufacturing costs. And adding a margin to an inaccurate estimate does not solve the problem. It simply passes it on to the selling price, along with the cost breakdown no one has looked at again, which purchasing and planning also use.
Adding 30% is not the same as getting a 30% margin
There is also a fairly common confusion between two concepts that seem equivalent, but are not.
Suppose it costs 100 € to manufacture a product and we decide to add 30%. The resulting price will be 130 €. But if we calculate what percentage the 30 € difference represents of the selling price, we get a margin of 23.08%, not 30%.
To achieve a 30% margin on sales, starting from a cost of 100 €, we would need to sell at 142.86 €: the cost divided by 0.70, not multiplied by 1.30. That is a difference of 12.86 € per unit.
| What is applied | Price | Margin on the sale |
|---|---|---|
| 30% markup on cost (× 1.30) | 130.00 € | 23.08% |
| 30% margin on the sale (÷ 0.70) | 142.86 € | 30.00% |
In a factory that produces thousands of units, an apparently small misunderstanding can lead to a significant deviation from expected profitability. And all this assumes that the 100 € cost has been calculated correctly.
The cost-plus-markup method has its uses. It gives us a reference point and makes us think about how much it costs to produce. But it has a fundamental limitation: we are trying to decide how much the market should pay by looking only inside our factory.
Five different ways to calculate the price of a product
We can approach pricing from different perspectives. Each one answers a different question, which is precisely why comparing them is useful.
1. Based on costs: how much do we need to charge?
Let us start with the traditional method. We calculate the cost of the product and set a markup or target margin. It is simple, easy to understand, and especially useful for understanding our financial needs.
But there is one condition: we need to know our costs accurately enough. In manufacturing, it is not enough to add up materials and direct labor. We also need to consider setup times, actual consumption, scrap, rework, and a reasonable allocation of indirect costs.
That does not mean all costs should be treated the same. Variable costs, fixed costs, and costs specifically associated with an order serve different purposes in different decisions. Setting the regular price of a product is not the same as assessing a special order when we have spare capacity: in the second case, the fixed costs have already been covered, and any price above variable cost contributes something.
Costs help us understand the economic limits of our decisions. The mistake is thinking that those limits automatically determine the optimal price.
2. Based on value: how much is the customer willing to pay?
Cost looks inward. The second perspective looks across the counter.
Imagine two manufacturers offering an apparently equivalent part. The first can deliver it in three weeks. The second, in five days. For a customer who needs a replacement part before their production line stops, that difference can be enormously valuable.
In that case, does it make sense for both manufacturers to set their prices using only their manufacturing costs? Probably not.
Value-based pricing starts with what our product means to the customer: reliability, speed, customization, quality, or lower costs in their own business. A part that costs 50 € to manufacture can have very different value depending on where it is used, what problem it solves, and what alternatives the buyer has.
This approach has its own difficulties, too. It is not enough to claim that we offer higher quality or better service. We need to understand which advantages the customer actually values and verify that they are willing to pay for them.
The market does not necessarily reward our manufacturing effort. It rewards the value the customer perceives in the result.
3. Based on the competition: what is the market charging?
If value is what the customer might pay, the competition reflects what customers are already used to paying. If we sell a standard component and several competitors offer equivalent products at similar prices, that information matters: it helps us understand the price range and assess whether we can compete on price or need to differentiate ourselves.
But here another trap appears. Imagine our competitor sells a part for 120 € and we decide to match the price so we do not lose orders. What we do not know is that they use a more productive machine, manufacture larger batches, or have a lower material cost. Selling at 120 € may be profitable for them and not for us.
The opposite can also happen: perhaps we are much more efficient and could offer a lower price without compromising our profitability.
Copying a price without knowing the differences between factories is just as risky as calculating it without looking at the market. That is why competitors’ prices should serve as a reference, not an instruction.
4. Based on target profitability: how much do we need to earn?
The first three look at the product. The fourth starts with the result we want the company to achieve.
Suppose a company has variable costs of 60 € per unit, annual fixed costs of 120,000 €, and expects to sell 4,000 units. If it wants to earn an operating profit of 40,000 €, it will need an average price of 100 € per unit: 60 € in variable costs plus 160,000 € spread across 4,000 units.
This calculation connects price with the company’s financial objectives. But consider what happens if projected sales do not materialize. If instead of 4,000 units we sell 3,000, the price needed to achieve the same profit rises to approximately 113.33 €. In other words, the price we need to charge also depends on the volume we are actually able to sell.
And there is a trap here worth anticipating. If every time volume falls we recalculate costs by spreading the same fixed costs across fewer units, we raise the price just when the market is buying less. We lose more orders, volume falls again, and unit cost rises again. It is a spiral.
The Spanish accounting standard avoids exactly that when calculating the cost of manufacturing. The ICAC Resolution of April 14, 2015 requires indirect costs to be allocated according to the normal capacity of production facilities, and unused capacity costs, or idle capacity, to be recorded as an expense for the year instead of being charged to the part. It is not a pricing rule, but the same principle applies: the cost you use for quoting should be calculated using the volume your plant produces under normal conditions, not the volume it produced this quarter. The 3,000 units are a scenario to consider, not a cost to pass on.
That is why this strategy is useful for building scenarios, but should not be used in isolation.
5. Based on capacity: which orders are worth making?
The last perspective is the one most easily overlooked, and the only one that looks neither at the customer nor at the income statement, but at the machine.
We usually analyze how much margin each product generates. But in a factory with limited resources, we also need to ask how much time it takes to generate that margin.
Imagine two products that need to go through the same machine, which is currently saturated. Product A generates a contribution margin of 60 € per unit and needs two machine hours. Product B generates 50 € and needs one hour. At first glance, product A seems more profitable. But when we calculate contribution margin per hour of the critical machine, we discover something interesting:
- Product A generates 30 € per hour.
- Product B generates 50 € per hour.
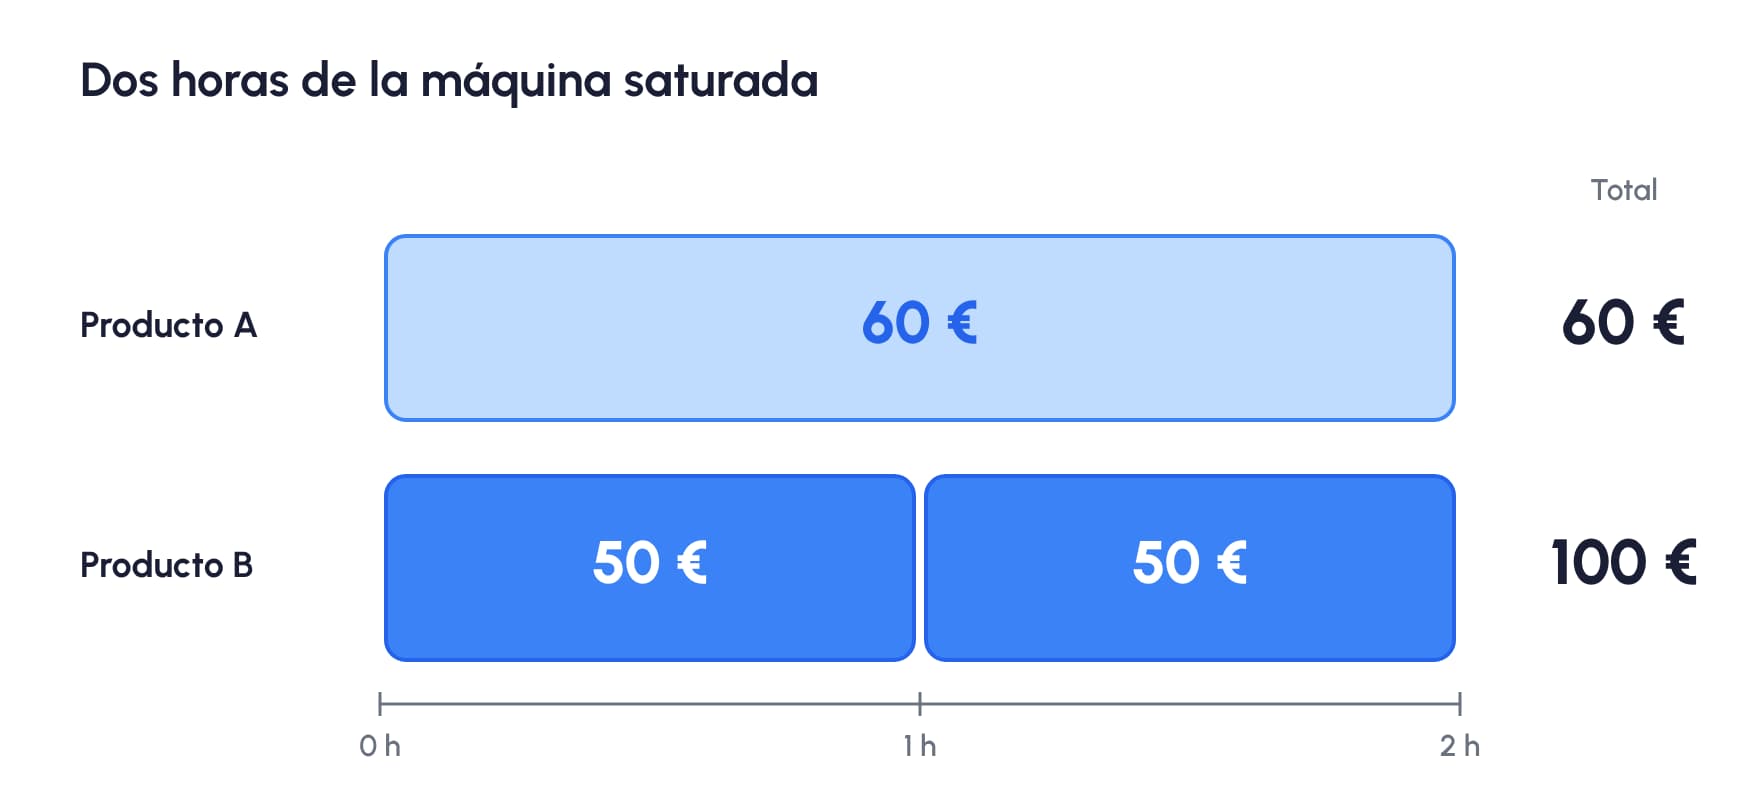
If we have enough demand and the other conditions are comparable, making product B may allow us to generate a greater total contribution.
We are not saying we should always reject product A. Commercial commitments, strategic customers, and other factors matter, too. What matters is the mechanism: when capacity is limited, every hour we devote to one product is an hour we cannot devote to another.
And that mechanism, viewed the other way around, sets a minimum price. If the machine is full of product B, every hour you give to another part costs you the 50 € that B would have contributed in that hour. The floor for any order that uses it is no longer its cost; instead, it becomes:
Variable cost of the part + critical machine hours × what the product you displace contributes per hour.
When there is room on the machine, the second part is zero and the floor is variable cost. When the machine is full, that floor can be higher than the full cost, and that is where a price with a positive margin starts losing money without any spreadsheet warning you.
Do not choose one method: put them all to work on the same part
At this point, it seems clear that each strategy contributes part of the answer. Costs tell us how much we need to recover. The market gives us a competitive reference. Perceived value helps us understand how much the customer might be willing to pay. Target profitability connects price with our financial needs. And capacity analysis shows us how each order affects the factory as a whole.
So why choose just one of them?
Imagine we are evaluating the price of a new part (illustrative example). Its full cost is 100 €, of which 70 € is variable, and it needs 1.6 hours on the critical machine, the same machine where product B contributes 50 € per hour. Based on that information:
- Cost plus 30%: 130 €.
- Target profitability, at the projected volume: 140 €.
- Market price for equivalent parts: 145 €.
- Value to the customer, thanks to lead time and reliability: 160 €.
- Capacity floor: 70 € if the machine has room; 70 + 1.6 × 50 = 150 € if it is full.
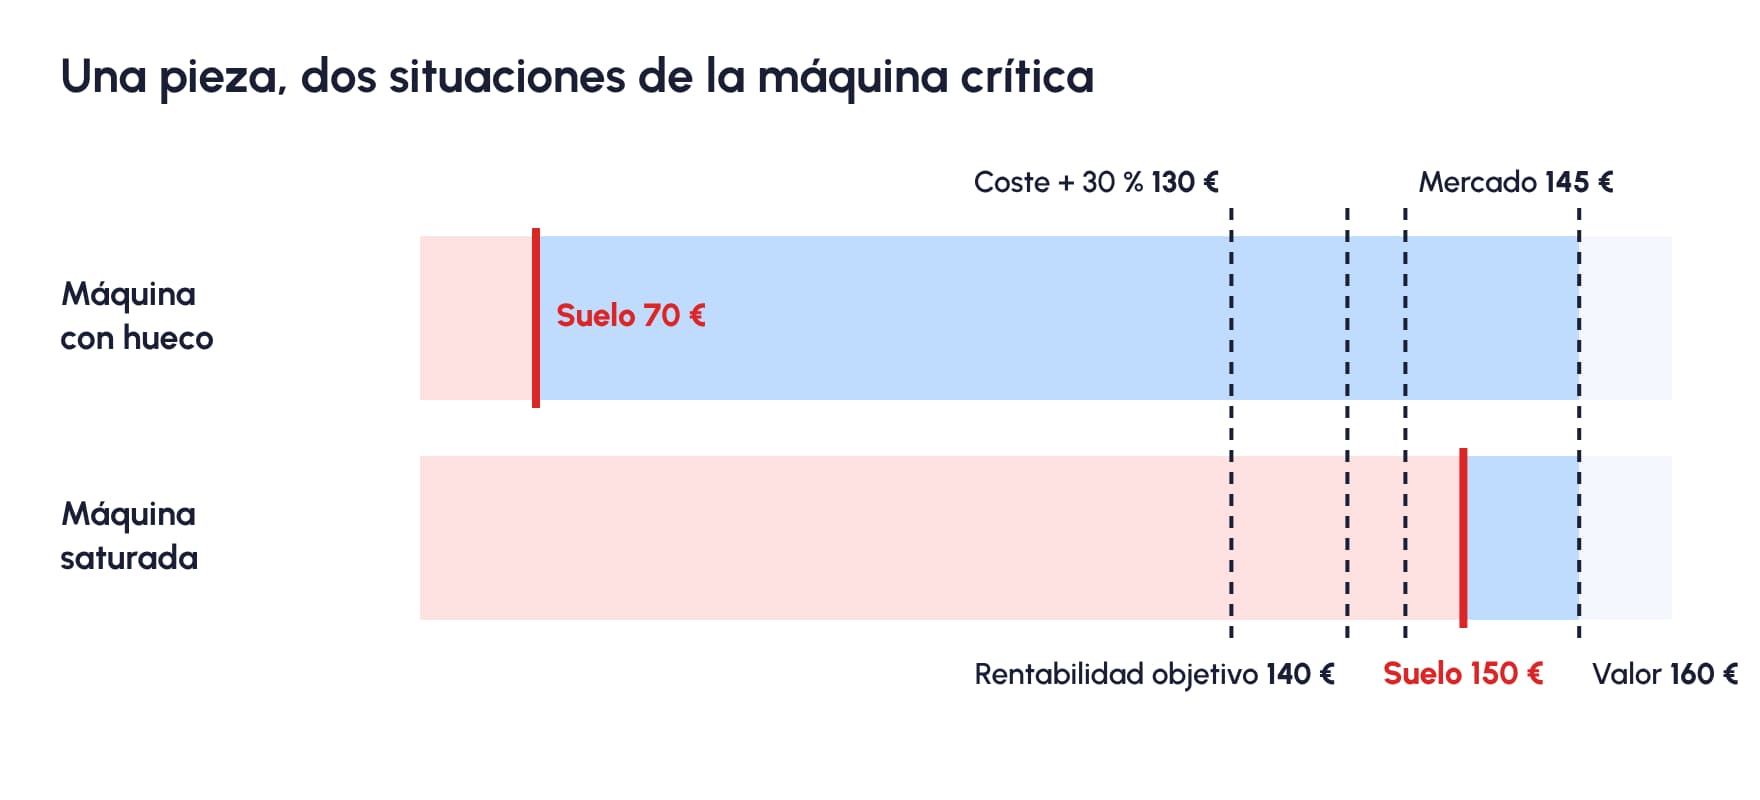
If we use only the first calculation, we will sell at 130 €. However, competitive analysis and customer value suggest there may be room to charge more.
This does not mean we should automatically set a price of 160 €. Perhaps we would lose too many orders at that price. Or perhaps our offering is not as different as we think.
And capacity changes the whole picture. With room on the machine, the range is from 70 to 160 €, and any of the reference points is defensible. With the machine full, the range narrows to between 150 and 160 €: at 130 €, and even at the market price, the part contributes less than the hour of product B it displaces.
Now we have information that lets us ask much more interesting questions. Can we sell at 145 € without losing too much volume, and do we have room on the machine to do so? What happens to total profit if we raise the price by 5%? Is it worth offering a discount for a large order? Do we have the capacity to handle it without delaying other, more profitable work?
The best strategy is not the one that produces the highest price, but the one that makes it possible to take the most profitable and sustainable decision for the business. And that requires comparing scenarios, not settling for a figure automatically generated by a spreadsheet.
The data missing from many profitability calculations
There is one problem that affects all the strategies above: the quality of manufacturing data. And almost always, the number that is wrong is an hour.
We can use the most sophisticated methodology in the world, analyze the competition, and study the value the customer receives. But if our costs are calculated incorrectly, we will still be making decisions on a weak foundation. And look at how many of the five calculations depend on hours: full cost, the capacity floor, and the question of which machine is the bottleneck in the first place.
Think of a factory with hundreds of part numbers. Each product has a manufacturing route and estimated times. However, actual times vary depending on the operator, machine conditions, batch size, or issues that arise during the process.
That data exists somewhere. Perhaps on a paper form, in an Excel spreadsheet, in the supervisor’s memory, or in records scattered across different systems. The problem is that it does not always end up connected to the cost calculation. When that happens, we may keep preparing quotes for months based on times that stopped reflecting reality a long time ago.
This difference between measuring what we think is happening and measuring what is actually happening also comes up when analyzing productivity, as we explain in Rethinking productivity measurement: beyond OEE. And it is one of the reasons why digitizing operations is valuable for more than just eliminating paper.
At Bold, hours are recorded where they happen: operators clock in at their workstation to record the start, downtime, and end of each operation on the job order, and that time is stored alongside the planned time in the part’s routing and the order cost. The next time someone quotes that part number, the six hours are already there, next to the four in the cost breakdown. That is what MOM software (Manufacturing Operations Management) does: connects production, materials, planning, and maintenance using the same data, so economic analysis starts with what happened on the factory floor.
Because there is no point perfecting our pricing strategy if we are still using manufacturing data that we never check against reality.
Sources
- Resolution of April 14, 2015, of the ICAC, establishing criteria for determining production cost — Official State Gazette No. 97, April 23, 2015: allocation of indirect costs according to the normal capacity of production facilities, idle capacity recorded as an expense for the year, and process-inherent scrap included as part of cost.
- OpenStax, Principles of Accounting Vol. 2, 3.1: Contribution Margin — definition of contribution margin and the relationship between price, variable costs, volume, and profit.
- OpenStax, Principles of Accounting Vol. 2, 10.2: Special Order Decisions — special orders: fixed costs are irrelevant when there is spare capacity, and when capacity is full, the production being displaced must be considered.
- OpenStax, Principles of Accounting Vol. 2, 10.6: Decisions When Resources Are Constrained — rank products by contribution margin per unit of the constrained resource, such as machine hours.
Conclusion
Calculating how much it costs to manufacture a product and adding a percentage is not necessarily a bad starting point. The problem is turning that calculation into the only reference for setting the price.
One product may cost us the same as another and provide much more value to the customer. It may generate an attractive margin per unit and yet take up too many hours of the resource that limits our production. Or it may seem profitable only because we are still working with times and costs that do not reflect reality.
That is why setting prices should be a commercial decision supported by economic and operational information, not the automatic result of applying a percentage. But before asking ourselves how much we should charge for a product, perhaps we should make sure we know how many hours it takes us to manufacture it.
Find out how Bold puts your plant’s actual hours behind every quote: request a demo 👇 and check it with your own part numbers.